Donald Trump is officially the president-elect of the United States. And politics aside, many pundits are thoroughly surprised that it happened.
The New York Times, as recently as the day of the election, placed Trump’s chances of winning at just 15 percent. Even GOP insiders yesterday stated on the record that they believed that Hillary Clinton would win.
So, how did this happen? And, perhaps even more intriguingly, what might have happened if Trump had faced Bernie Sanders instead of Hillary Clinton?
In May, Trump himself famously stated the following:
I would rather run against Crooked Hillary Clinton than Bernie Sanders and that will happen because the books are cooked against Bernie!
— Donald J. Trump (@realDonaldTrump) May 4, 2016
And when we now go back and analyze the exit poll data from the Democratic primary in a few key swing states, it becomes abundantly clear why Trump didn’t want to face Sanders.
A closer look at the primary voting of white males — Trump’s strongest demographic base — in these states reveals that, had Sanders run, Trump likely would have lost.
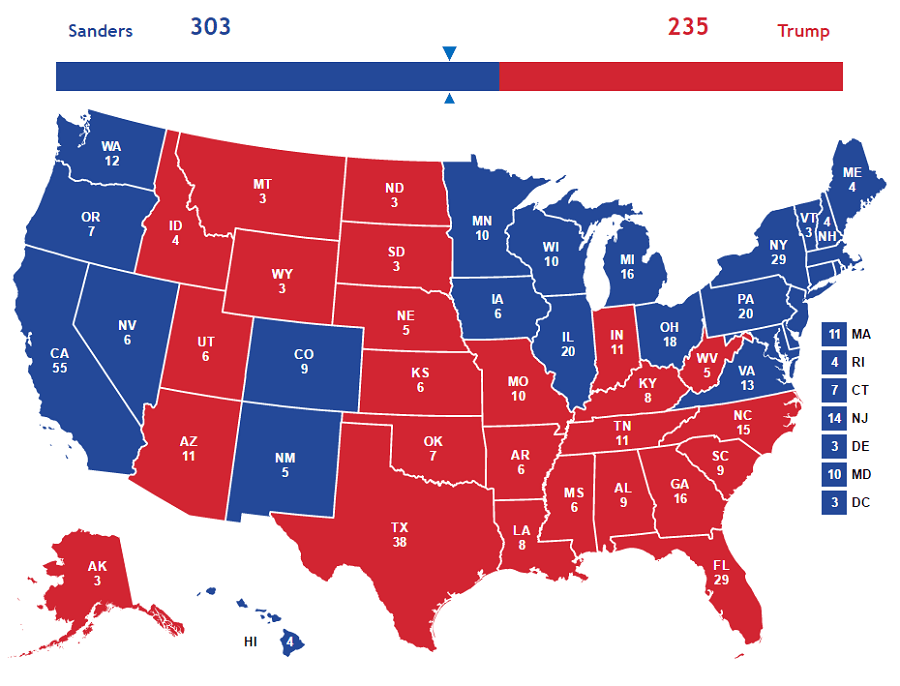
In Michigan, for example, primary exit poll data shows that 56 percent of white males voted for Sanders. If we then consider how many white males vote in Michigan, we can extrapolate the data to conclude that Sanders would have won the overall vote in Michigan with about 48 percent of the vote compared to Trump’s 46.9 (as opposed to the 47.9 that Trump actually gained versus the 46.9 for Clinton).
Furthermore, if we analyze the data in the same way in a few other key states — while keeping the numbers in every other state as they were — we see similar swings in Sanders’ favor that very likely would have handed the presidency to the Democrats:
Wisconsin
- Primary voting for Sanders among white males: 60 percent
- Sanders’ hypothetical statewide performance against Trump: 49.7 percent Sanders, 47 percent Trump
Ohio
- Primary voting for Sanders among white males: 57 percent
- Sanders’ hypothetical statewide performance against Trump: 47.9 percent Sanders, 47.7 percent Trump
Iowa
- Primary voting for Sanders among males (Data for white males specifically unavailable): 50 percent
- Sanders’ hypothetical statewide performance against Trump: 48.2 percent Sanders, 47.6 percent Trump
Pennsylvania
- Primary voting for Sanders among white males: 50 percent
- Sanders’ hypothetical statewide performance against Trump: 50.5 percent Sanders, 46.2 percent Trump
New Hampshire
- Primary voting for Sanders among white males: 67 percent
- Sanders’ hypothetical statewide performance against Trump: 51.5 percent Sanders, 45.4 percent Trump
Taken together, these victories would have been more than enough to give Sanders the presidency. What’s more, actual polling data from several established sources taken throughout this year consistently showed that a Sanders/Trump matchup would have come out in Sander’s favor by a sizable margin.
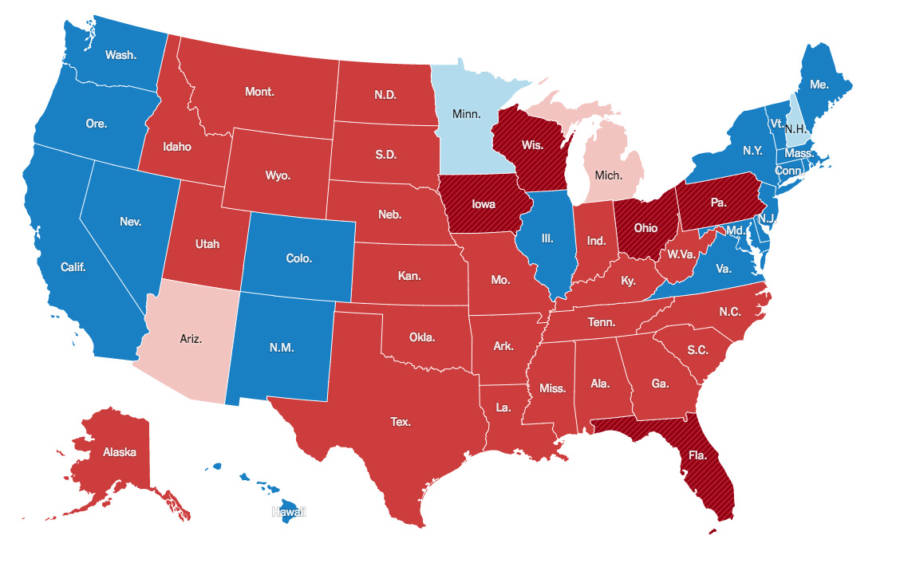
Of course, it was Clinton that Trump faced, not Sanders, and here’s how the electoral map actually turned out: